

"Data" is the word everybody used to hear nowadays. Google gathers data about its users, market specialists use data to get to know customers, businesses collect data about key performance indicators, you are reading this article your device got the data on this article from our server. The data is everywhere.

However, raw data is useless. That is why people and businesses need effective ways to analyze and manage data. It's especially necessary for large companies with a big number of business processes, operational tasks, performance metrics, sales numbers, etc. The bigger a company becomes the more information it generates. That is when data visualization comes in handy.
In the article, we will discuss everything you need to know about data visualization: what the data visualization is, current trends, key features, benefits, and drawbacks. And we also discuss the list of best companies that offer data visualization services to their clients.
What is Data Visualization?
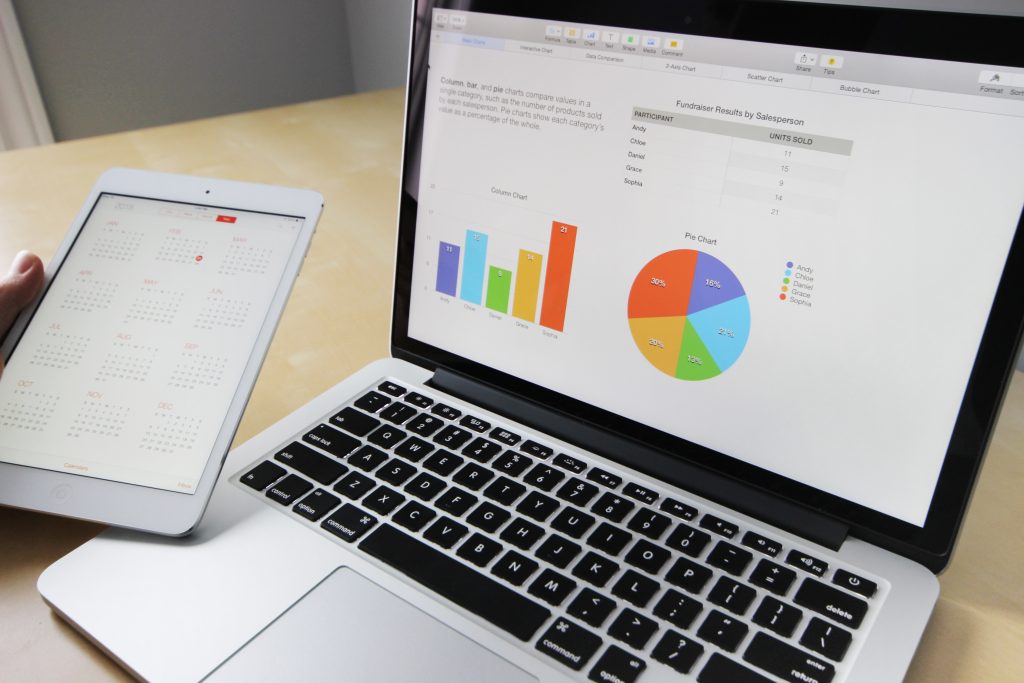
Data visualization is the term that is used to describe the graphical representation of data. In the modern era, the age of technology generates a large volume of data, so data visualization is the only solution that allows people to analyze it. It is much easier and time-saving to understand data in the form of animations and charts rather than as long text data.

We want to highlight the fact that data visualization is a tool for people to analyze data because there are technologies like Big Data methods and Machine Learning algorithms that analyze the data instead of humans and only provide insights after the analysis. If you want to learn more about these methods, read our article the Internet of Things and Big Data.
Data Visualization Vs Excel
You may wonder whether Excel is a data visualization tool or not. To clarify this we can refer to the description in Excel. Excel is a spreadsheet developed by Microsoft. It features calculation or computation capabilities, graphing tools, pivot tables, and a macro programming language.
So, we see here a part "graphical tools" which means that Excel provides you with the option to graphically represent the data. However, visualization is not its core function since, first of all, Excel is a spreadsheet that stores your data within rows and columns. As a result, the visualization opportunities Excel provides to users can't compete with opportunities of other, more powerful platforms for data visualization like Microsoft Power BI or Tableau.
Where Fetch And Store Data
First of all, it's necessary to understand that before implementing data visualization software it's necessary to understand the requirements you have for this software. The point of data visualization is not just to analyze any data, but to analyze the data relevant to your business. So, you are likely to have databases or even excel sheets with raw data you want to analyze. Nowadays good options where you can store the data are SQL and NoSQL solutions. However, if your data doesn't count hundreds of thousands of lines, excel is also acceptable.
If you are looking for sources where you can fetch the data, check these online sources:
- Data.gov
- Socrata
- Google Finance
- Facebook API
Current Data Visualization Trends
Video Infographics
According to a recent study published by American Educational Research Association, when people get information from videos instead of text or pictures they absorb information much better. Besides, 67% of users prefer to learn about a new product or service through video.
That means that a visual infographic is not only an effective way for storytellers to convey information but also the desired way by users to acquire new information.
And we see it all around the Internet. Companies develop promo videos to present new products, and they make fascinating short music videos to introduce the company's mission, values, and focus. Video infographics can be named even one of the latest trends in web development in general.
Real-Time Visualization
Real-time data visualization means that the data is constantly updated in real-time. So, when the source of data gets the information as an input, the software immediately displays this information in the form of some visuals. This trend appeared in recent years because of the wide adoption of the Internet of Things technology and increased demand for real-time data across various industries. The reason is simple -- a manufacturer that placed a big order of spare parts for its production facilities probably wants to know the exact location of the order to keep non-stop production. The doctor needs to track the physical parameters of his patient in real-time to timely react to emergencies or even prevent them. The low delay in data delivery plays a crucial role nowadays.

Data goes democratized
Data democratization means that people with no specific knowledge and software can access the publicly available data and benefit from it. You can find various examples of data visualization on the Internet, like the world map of air quality index in real-time. In addition to such public data sources, people get access to low-code and no-code platforms as well as to some dashboard templates that they can download and customize to their needs. All that means that now anybody can use data visualization tools and benefit from data. No specific skills are required.
Types of Data Visualization Services
Companies that provide data visualization services develop the following list of software solutions:
- Dashboard Software
- Data Mining Software
- Mobile Business Intelligence Software
- Predictive Analytical Software
Key Features of Data Visualization Software
Basic Visualization: includes different types of charts, visual data, infographics, heat maps, etc.
Data Import/Export: It allows the import of data from excel sheets and the export in various forms.
- Sharing Data Visualization: Sharing with other people and departments through email, social media messengers, etc.
- Data/event alerts: Notifications about the data being updated or other event notifications.
- Interactive visuals: Such options as filtering, sorting, resizing, and drag and drop functionality would help here.
Benefits of Data Visualization Services
- Customer Satisfaction: Businesses can discover new opportunities to increase customer satisfaction to completely stand out from the competitor.
- Fast Trend Adoption: This service allows managers of the teams to quickly change from one perspective to another which seems beneficial for the company.
- The Alignment of Business Goals and Operational Activities: Employees can easily monitor the progress towards achieving business goals with the current operational activity of the company. For example, managers can identify issues that prevent achieving a high customer satisfaction rate like poor call center quality.
- Quick Understanding: People are quicker at finding information with the help of visuals than people who don't use them.
Drawbacks of Data Visualization Services

Custom data visualization software is expensive: Custom software is costly and can be considered unsuitable for small and medium-sized businesses. In addition to development costs, there are costs of deployment, maintenance, and employee training. Big companies can afford all these expenses while small and medium-sized businesses can consider using templates or data visualization platforms on a subscription basis.
User training is advisable: Implementing a new tool like data visualization software implies that employees should get to know how to use it. They can learn the tool by themselves, however, it will be less effective than taking special courses or training programs. That means that business owners should be ready to spend some money on training and give employees time to acquire the necessary skills to use it.
What Are Best Data Visualization Service Providers
We know that it can be hard to find the right company among all companies on the Internet (for example, to find a mobile app development firm). There are a lot of companies that provide data visualization services but we have shortlisted the top 10 companies that demonstrate the top-notch quality of their data visualization software solutions.
SumatoSoft
![]()
SumatoSoft is a custom software development company that helps companies to digitalize their businesses. During the software development, SumatoSoft leverages modern technologies like Artificial Intelligence, Machine learning, and the Internet of Things to deliver the maximum value to its clients. After 9 years of custom software development, the SumatoSoft team honed skills in leveraging these technologies resulting in a 98% of clients satisfaction rate.
Pros:
- The cooperation with clients is based on full transparency
- Properly set transparent processes that result in timely delivery of the software
- 70% of senior level engineers in the team
- The company demonstrates a strong focus on business needs
Price:
$50 -- $99/Hour
Technource
Technource is one of the top-ranked online platforms in countries like India (Ahmedabad & Jaipur), UAE(Dubai), USA(Delaware) and Malaysia. With a competent team, this platform has always been resiliently tackling all sorts of technical challenges on its way. The main objective of this well-reputed platform is to understand the agenda of its clients and deliver them what they exactly need. Its developers master a wide range of current technologies that allow it to offer its clients dynamic IT solutions to their technical problems.
Pros:
- This company ensures easy communication.
- They organize regular meetings, especially on the weekly basis.
Price:
$25 -- $49/Hour
Brain Technologies
![]()
With their latest technologies, 3Brain Technologies are known as pioneer in top class web and mobile apps. Their decisions are guided by logic and details. This is something which has resulted in a sustainable growth in their clients' businesses. This platform is a top-pick among web developers in India. It claims to deliver the best services to its clients from all over the world.
Pros:
- They have a friendly and talented team.
- Their professionalism is evident throughout the development cycle.
- They allow their clients to be in direct contact with their CEO in case of requests or problems.
Price:
< $25/Hour
Relevant Software

Relevant is an international software development company that is well-known for designing, building and delivering products of world-class standard for more than Fortune 500 companies and promising startups. It always puts it customers' needs first and thus, achieves the results. Best engineers from all across the globe are part of its team which makes it even more resilient to handle tech-related problems.
Pros:
- They are flexible enough to adapt to their client's needs, including technological ones as well.
- They offer support and great communication throughout the project.
- Level of expertise in engineering is amazing.
Price:
$25 -- $49/Hour
Linea Digitech

Linea Digitech is a flourishing software development, app development, and digital marketing company. It has its head offices in Saudi Arabia and India. This company has been continuously working hard in order to improve the overall user experience over mobile apps by using different latest technologies such as Artificial Intelligence, Big Data and Chat Bot etc. While settling the projects with clients, the company never keeps anything hidden from them. Dedication and commitment are the main areas of focus for this company.
Pros:
- They have transparency in their service.
- They deliver the committed service in the given timeline.
Price:
$25 -- $49/Hour
NIX

With an experience of more than 27 years in the software engineering business, this company has delivered over 3000 dynamic IT solutions to the clients from all over the world. This software engineering platform delivers innovative technology solutions with more than 2700 data visualization software experts onboard.
Pros:
- They are fast and responsive.
- Quality of the work they deliver is outstanding.
Price:
$50 -- $99/Hour
InnovationM

InnovationM is a well-known company specializing in designing & developing services in the technology domain. It has its major focus on an end to end solution development (custom application development & product development) on mobile, server back-end, middleware, web, cloud technologies, and blockchain solutions. Specialized service areas of this platform include New Concept Design and Technology Architecture and Design Services.
Pros:
- Timely execution of work and professionalism.
- Fast responses to any questions.
Price:
< $25/hr
Prakash Software Solutions

With a crew of nearly 100 experienced and certified developers who are masters at Microsoft and different data visualization software, Prakash Software Solutions is pro at Net and SharePoint development. This platform uses data visualization tools like SharePoint 2010, WSS 3.0, MOSS 2007, SharePoint 2013, Cloud Computing, Office 365, and Azure.
Pros:
- They are able to complete the tech tasks fast.
- They quickly respond to asked questions when needed.
Price:
- $25 -- $49/Hour
Serokell

This software company comes up with the modern solution for your complex technical problems. From mathematicians to computer scientists, QA engineers to developers, this data visualization company has all the experts onboard at the same time. Its users admire Serokil for being knowledgeable, efficient and resourceful.
Pros:
- Their team is extremely professional and talented.
- They show a great standard of technical knowledge.
- They have excellent communication skills.
- They respect deadlines and schedules of the clients.
Price:
$50 -- $99/Hour
Clotfox Provate Limited

This award-winning marketing agency is located in Bangalore. It is assisting brands in manufacturing their products and providing services. By using different technical facilities and data visualization softwares, it has made communication much easier than it was before. Coltfox's goal is to provide its clients with creative insight as well as commercial awareness they need to flourish their business.
Pros:
- Not only in development, they are helpful in redesigning websites as well.
- They have a quick timeline.
- They can design attention-grabbing marketing campaigns for your business.
Price:
< $25/Hour
Conclusion:
Ultimately, data visualization is a great tool to drive your business. Along with low code platforms that are available to everyone, there are a lot of companies that provide custom data visualization software development services. The benefits the custom software brings are hard to underestimate. To get benefits the company will need to spend money on software development and employee training which can cost a lot. However, data visualization is worth spending money on.